The blind men of our tale begin their day in a bar. They are drinking together when a man runs in and says; “I have a problem! I have found this amazing creature but I don’t know what it is!”
Unfortunately, for our befuddled zoo keeper – there are no customers in the bar except the blind guys. However, emboldened by the beer, they offer to give their professional opinion on the creature using nothing but the power of touch.
They shuffle out of the bar and into the stall where our mystery creature is to be found. The creature, as we know is an elephant, but that’s not what our blind men discover.
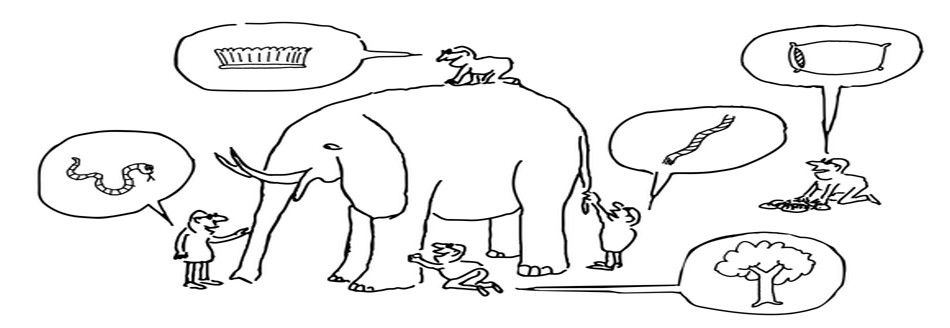
The first reaches out to touch a leg and reports that the creature must be like a mighty pillar. The second grabs the tail and exclaims that the creature is made of rope. The third grabs the trunk and claims that the creature is like a branch of a tree. The fourth finds himself clutching an ear and decides the creature is like a hand fan. The fifth, touches the belly and compares the creature to a wall. Finally, the sixth grabs onto a tusk and decides the elephant must be made of solid pipe.
Of course, all of our blind men are correct. They’ve each touched the creature and discovered something of its true nature. What they’ve failed to do is see the big picture of the elephant itself which is a combination of all these things.
Nice Story but What Does This Have to Do With UX?
That’s a great question. It has quite a lot to do with UX research when we start to look closely at the way research works.
Sample Sizes
Users are a bit like our blind men. Think of a product like Microsoft’s Windows. There’s a lot to Windows, certainly more than the average user is ever going to encounter. I’ve been using Microsoft since the days of MS Dos and I find myself regularly tripping over features that I had no idea were there.
So when we ask a user for an opinion; we’re quite often only getting a piece of the puzzle and not that all important big picture.
In order to see the whole picture, we need to talk to enough users with enough breadth of experience to get all the pieces of the puzzle. This means that at times, we’re going to duplicate lots of pieces to the puzzle too. You may find that 100 users see the “wall like” qualities of your elephant but only 1 sees the “hand fan”.
As UX researchers, we need to ensure that the sample sizes are big enough to see the whole of the elephant.

Author/Copyright holder: Leaflet. Copyright terms and licence: CC BY-SA 3.0
Most companies are still organized in silos; with departments that do not communicate nor collaborate.
Fragmented Management
Lou Rosenfeld (the founder of Rosenfeld Media and author of Search Analytics for Your Site), writing for A List Apart, notes another problem when it comes to identifying the elephant: corporate silos.
In big corporates there may be many repositories of data and it may be challenging (or indeed impossible) for the right people to access the right data at the right time. This can lead to one team holding a problem and another, which could hold the solution, not knowing about it.
That might be because they don’t know that the other team exists or that there’s no sensible communication structure in the business or that they don’t even use the same language when talking about problems and solutions (so even if they did know about each other – they still couldn’t work together effectively).
That means that UX researchers (and company management) need to create the conditions that enable their blind men to get together and pool their ideas so that the UX teams can start to see the elephant.
How do You Do That?
Lou offers several ways to improve the research landscape in an organization to get the big picture:
Bring a Balanced Approach To Research Methods Used
You don’t have to use every research methodology available to you but you do need to use enough methods to get a clear picture of the situation that you’re facing. That means seeking balance with your methods to get the best coverage of behaviour and attitude examination and between qualitative and quantitative data.
Christian Rohrer offers a neat diagram of the Landscape of User Research Methods at the Nielsen Norman Group’s blog.
By selecting methods from different quadrants of this diagram, you increase the number of “blind men” reporting their pictures to you.
Develop a Continuous Snapshot of The Big Picture
Unlike our elephant, the big picture of user experience changes constantly. Products are superseded either by technology or innovation. Service requirements can disappear overnight.
That means we need to ensure that we’re constantly checking in with our users and ensuring we know what they’re thinking now – not just what they thought when we began our project. That might mean running low-cost, fast-execution research monthly or quarterly and running higher-cost or slower-execution research annually.
Get Teams and Researchers Talking
We want our teams to pool their knowledge when it’s useful to us. That may mean spending time creating a common language and a common understanding of what’s required of them when it comes to user experience work. Interdisciplinary working will provide a ton of additional benefits too – when wider groups start to interact, you get many additional viewpoints and ideas that might not have come from working alone.
This can be done formally through meetings and planned sessions or informally (there’s nothing to stop a researcher from going to see another group and asking what they’re working on). It can be done through information sharing (such as providing user personas to marketing or engineering). It can be done in a million ways but it’s important to find at least one way and start using it.
This pooling of information lets us see the elephant more clearly and prevents us from acting on our own “blind man” findings.
Pool Your Data
To see the big picture, you have to bring together all the blind men’s feedback. There’s only an elephant when an outside observer listens to everything they have to say, asks a few questions and deduced that they’ve got an elephant (as opposed to a hippo or a donkey).
This can be done by pooling all the data in a single repository and making that repository simple and easy to use. That might mean designing a visual dashboard to give someone a high-level understanding of the elephant before they drill down into a specific set of research or requirements. It might mean a written document that explains the big picture (as it is currently understood). There’s no right way to do this – you can do whatever works for you and the teams you work with.
The Take Away
This isn’t really about blind men and elephants. It’s about seeing the big picture in our research. The blind men offer us a useful metaphor for what we can’t see when we’re not looking for it.
That means as user researchers we want to try and use meaningful samples sizes in our research to get the opinion of enough “blind men” to be relevant. Then we need to ensure that our research offers enough balance so that we can determine what people say and what they do. We need both qualitative and quantitative data to provide real insight. We need to keep an eye on the picture in case it changes and that means developing a rhythm to our research so that it is constantly evolving that picture.
We need to work with everyone involved with users to ensure that we are not “blind men” ourselves and finally we need to bring all the data generated together into one place so that we can develop that big picture and share it with others who need it. Only then can we see the elephant.
References
Header Image: Author/Copyright holder: Unknown. Copyright terms and licence: Unknown. Img
Read Lou Rosenfeld’s detailed breakdown of this concept at A List Apart and find out more about how the blind men and the elephant can help you see the big picture here.
Aaron Walter explains how MailChimp built their data repository here for some ideas as to how you might build yours. Take a look here.
Want the most famous version of the blind men and the elephant story? You’ll find it here in poetic form.
If you’d like the deep background on the blind men and the elephant and how it has been influenced by religion across the centuries, you can read about it here.


