Your constantly-updated definition of Quantitative Research and
collection of videos and articles. Be a conversation starter: Share this page and inspire others!
1,924shares
What is Quantitative Research?
Quantitative research is the methodology which researchers use to test theories about people’s attitudes and behaviors based on numerical and statistical evidence. Researchers sample a large number of users (e.g., through surveys) to indirectly obtain measurable, bias-free data about users in relevant situations.
“Quantification clarifies issues which qualitative analysis leaves fuzzy. It is more readily contestable and likely to be contested. It sharpens scholarly discussion, sparks off rival hypotheses, and contributes to the dynamics of the research process.”
— Angus Maddison, Notable scholar of quantitative macro-economic history
ShowHide
video transcript
Transcript loading…
See how quantitative research helps reveal cold, hard facts about users which you can interpret and use to improve your designs.
Use Quantitative Research to Find Mathematical Facts about Users
Quantitative research is a subset of user experience (UX) research. Unlike its softer, more individual-oriented “counterpart”, qualitative research, quantitative research means you collect statistical/numerical data to draw generalized conclusions about users’ attitudes and behaviors. Compare and contrast quantitative with qualitative research, below:
Quantitative Research
Qualitative Research
You Aim to Determine
The “what”, “where” & “when” of the users’ needs & problems – to help keep your project’s focus on track during development
The “why” – to get behind how users approach their problems in their world
Methods
Highly structured (e.g., surveys) – to gather data about what users do & find patterns in large user groups
Loosely structured (e.g., contextual inquiries) – to learn why users behave how they do & explore their opinions
Number of Representative Users
Ideally 30+
Often around 5
Level of Contact with Users
Less direct & more remote (e.g., analytics)
More direct & less remote (e.g., usability testing to examine users’ stress levels when they use your design)
Statistically
Reliable – if you have enough test users
Less reliable, with need for great care with handling non-numerical data (e.g., opinions), as your own opinions might influence findings
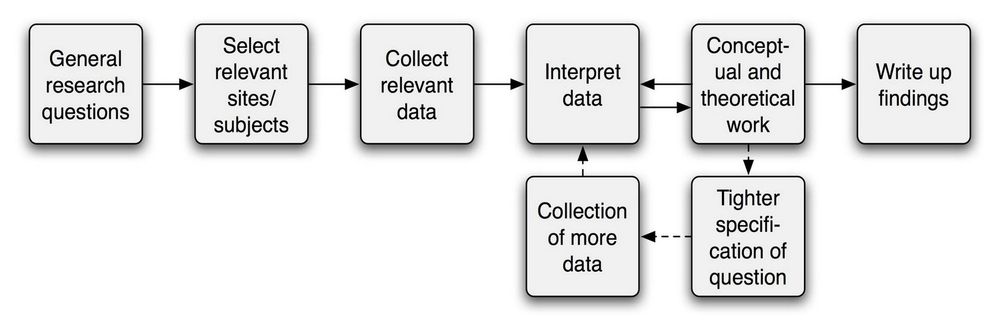
Quantitative research is often best done from early on in projects since it helps teams to optimally direct product development and avoid costly design mistakes later. As you typically get user data from a distance—i.e., without close physical contact with users—also applying qualitative research will help you investigate why users think and feel the ways they do. Indeed, in an iterative design process quantitative research helps you test the assumptions you and your design team develop from your qualitative research. Regardless of the method you use, with proper care you can gather objective and unbiased data – information which you can complement with qualitative approaches to build a fuller understanding of your target users. From there, you can work towards firmer conclusions and drive your design process towards a more realistic picture of how target users will ultimately receive your product.
Author / Copyright holder: Teo Yu Siang and the Interaction Design Foundation. Copyright terms and license: CC BY-NC-SA 3.0
Quantitative analysis helps you test your assumptions and establish clearer views of your users in their various contexts.
Quantitative Research Methods You Can Use to Guide Optimal Designs
There are many quantitative research methods, and they help uncover different types of information on users. Some methods, such as A/B testing, are typically done on finished products, while others such as surveys could be done throughout a project’s design process. Here are some of the most helpful methods:
A/B testing – You test two or more versions of your design on users to find the most effective. Each variation differs by just one feature and may or may not affect how users respond. A/B testing is especially valuable for testing assumptions you’ve drawn from qualitative research. The only potential concerns here are scale—in that you’ll typically need to conduct it on thousands of users—and arguably more complexity in terms of considering the statistical significance involved.
Analytics –With tools such as Google Analytics, you measure metrics (e.g., page views, click-through rates) to build a picture (e.g., “How many users take how long to complete a task?”).
Desirability Studies –You measure an aspect of your product (e.g., aesthetic appeal) by typically showing it to participants and asking them to select from a menu of descriptive words. Their responses can reveal powerful insights (e.g., 78% associate the product/brand with “fashionable”).
Surveys and Questionnaires – When you ask for many users’ opinions, you will gain massive amounts of information. Keep in mind that you’ll have data about what users say they do, as opposed to insights into what they do. You can get more reliable results if you incentivize your participants well and use the right format.
Tree Testing –You remove the user interface so users must navigate the site and complete tasks using links alone. This helps you see if an issue is related to the user interface or information architecture.
Another powerful benefit of conducting quantitative research is that you can keep your stakeholders’ support with hard facts and statistics about your design’s performance—which can show what works well and what needs improvement—and prove a good return on investment. You can also produce reports to check statistics against different versions of your product and your competitors’ products.
Most quantitative research methods are relatively cheap. Since no single research method can help you answer all your questions, it’s vital to judge which method suits your project at the time/stage. Remember, it’s best to spend appropriately on a combination of quantitative and qualitative research from early on in development. Design improvements can be costly, and so you can estimate the value of implementing changes when you get the statistics to suggest that these changes will improve usability. Overall, you want to gather measurements objectively, where your personality, presence and theories won’t create bias.
Learn More about Quantitative Research
Take our User Research course to see how to get the most from quantitative research.
What is the difference between qualitative and quantitative research?
Qualitative and quantitative research differ primarily in the data they produce. Quantitative research yields numerical data to test hypotheses and quantify patterns. It's precise and generalizable. Qualitative research, on the other hand, generates non-numerical data and explores meanings, interpretations, and deeper insights. Watch our video featuring Professor Alan Dix on different types of research methods.
ShowHide
video transcript
Transcript loading…
This video elucidates the nuances and applications of both research types in the design field.
What is a good sample size for quantitative research?
In quantitative research, determining a good sample size is crucial for the reliability of the results. William Hudson, CEO of Syntagm, emphasizes the importance of statistical significance with an example in our video.
ShowHide
video transcript
Transcript loading…
He illustrates that even with varying results between design choices, we need to discern whether the differences are statistically significant or products of chance. This ensures the validity of the results, allowing for more accurate interpretations. Statistical tools like chi-square tests can aid in analyzing the results effectively. To delve deeper into these concepts, take William Hudson’s Data-Driven Design: Quantitative UX Research Course.
Why is quantitative research important?
Quantitative research is crucial as it provides precise, numerical data that allows for high levels of statistical inference. Our video from William Hudson, CEO of Syntagm, highlights the importance of analytics in examining existing solutions.
ShowHide
video transcript
Transcript loading…
Quantitative methods, like analytics and A/B testing, are pivotal for identifying areas for improvement, understanding user behaviors, and optimizing user experiences based on solid, empirical evidence. This empirical nature ensures that the insights derived are reliable, allowing for practical improvements and innovations. Perhaps most importantly, numerical data is useful to secure stakeholder buy-in and defend design decisions and proposals. Explore this approach in our Data-Driven Design: Quantitative Research for UX Research course and learn from William Hudson’s detailed explanations of when and why to use analytics in the research process.
When to use quantitative research?
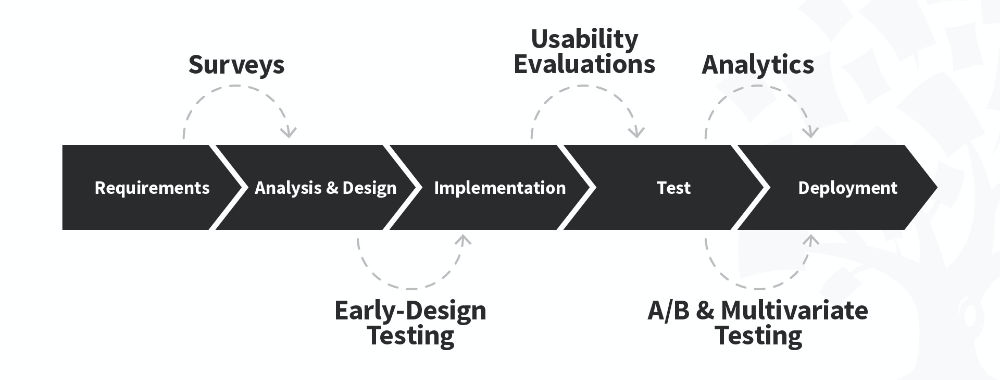
After establishing initial requirements, statistical data is crucial for informed decisions through quantitative research. William Hudson, CEO of Syntagm, sheds light on the role of quantitative research throughout a typical project lifecycle in this video:
ShowHide
video transcript
Transcript loading…
During the analysis and design phases, quantitative research helps validate user requirements and understand user behaviors. Surveys and analytics are standard tools, offering insights into user preferences and design efficacy. Quantitative research can also be used in early design testing, allowing for optimal design modifications based on user interactions and feedback, and it’s fundamental for A/B and multivariate testing once live solutions are available.
How to write a quantitative research question?
To write a compelling quantitative research question:
Create clear, concise, and unambiguous questions that address one aspect at a time.
Use common, short terms and provide explanations for unusual words.
Avoid leading, compound, and overlapping queries and ensure that questions are not vague or broad.
According to our video by William Hudson, CEO of Syntagm, quality and respondent understanding are vital in forming good questions.
ShowHide
video transcript
Transcript loading…
He emphasizes the importance of addressing specific aspects and avoiding intimidating and confusing elements, such as extensive question grids or ranking questions, to ensure participant engagement and accurate responses. For more insights, see the article Writing Good Questions for Surveys.
Is survey research qualitative or quantitative?
Survey research is typically quantitative, collecting numerical data and statistical analysis to make generalizable conclusions. However, it can also have qualitative elements, mainly when it includes open-ended questions, allowing for expressive responses. Our video featuring the CEO of Syntagm, William Hudson, provides in-depth insights into when and how to effectively utilize surveys in the product or service lifecycle, focusing on user satisfaction and potential improvements.
ShowHide
video transcript
Transcript loading…
He emphasizes the importance of surveys in triangulating data to back up qualitative research findings, ensuring we have a complete understanding of the user's requirements and preferences.
Is descriptive research qualitative or quantitative?
Descriptive research focuses on describing the subject being studied and getting answers to questions like what, where, when, and who of the research question. However, it doesn’t include the answers to the underlying reasons, or the “why” behind the answers obtained from the research. We can use both f qualitative and quantitative methods to conduct descriptive research. Descriptive research does not describe the methods, but rather the data gathered through the research (regardless of the methods used).
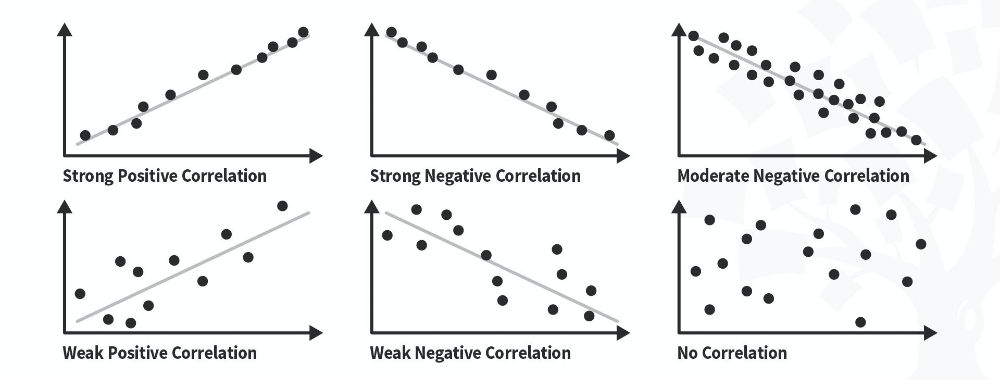
When we use quantitative research and gather numerical data, we can use statistical analysis to understand relationships between different variables. Here’s William Hudson, CEO of Syntagm with more on correlation and how we can apply tests such as Pearson’s r and Spearman Rank Coefficient to our data.
ShowHide
video transcript
Transcript loading…
This helps interpret phenomena such as user experience by analyzing session lengths and conversion values, revealing whether variables like time spent on a page affect checkout values, for example.
Which sampling technique is most desirable in quantitative research?
Random Sampling: Each individual in the population has an equitable opportunity to be chosen, which minimizes biases and simplifies analysis.
Systematic Sampling: Selecting every k-th item from a list after a random start. It's simpler and faster than random sampling when dealing with large populations.
Stratified Sampling: Segregate the population into subgroups or strata according to comparable characteristics. Then, samples are taken randomly from each stratum.
Cluster Sampling: Divide the population into clusters and choose a random sample.
Multistage Sampling: Various sampling techniques are used at different stages to collect detailed information from diverse populations.
Convenience Sampling: The researcher selects the sample based on availability and willingness to participate, which may only represent part of the population.
Quota Sampling: Segment the population into subgroups, and samples are non-randomly selected to fulfill a predetermined quota from each subset.
These are just a few techniques, and choosing the right one depends on your research question, discipline, resource availability, and the level of accuracy required. In quantitative research, there isn't a one-size-fits-all sampling technique; choosing a method that aligns with your research goals and population is critical. However, a well-planned strategy is essential to avoid wasting resources and time, as highlighted in our video featuring William Hudson, CEO of Syntagm.
ShowHide
video transcript
Transcript loading…
He emphasizes the importance of recruiting participants meticulously, ensuring their engagement and the quality of their responses. Accurate and thoughtful participant responses are crucial for obtaining reliable results. William also sheds light on dealing with failing participants and scrutinizing response quality to refine the outcomes.
What are the 4 types of quantitative research?
The 4 types of quantitative research are Descriptive, Correlational, Causal-Comparative/Quasi-Experimental, and Experimental Research. Descriptive research aims to depict ‘what exists’ clearly and precisely. Correlational research examines relationships between variables. Causal-comparative research investigates the cause-effect relationship between variables. Experimental research explores causal relationships by manipulating independent variables. To gain deeper insights into quantitative research methods in UX, consider enrolling in our Data-Driven Design: Quantitative Research for UX course.
What are the strengths of quantitative research?
The strength of quantitative research is its ability to provide precise numerical data for analyzing target variables.This allows for generalized conclusions and predictions about future occurrences, proving invaluable in various fields, including user experience. William Hudson, CEO of Syntagm, discusses the role of surveys, analytics, and testing in providing objective insights in our video on quantitative research methods, highlighting the significance of structured methodologies in eliciting reliable results.
This course empowers you to leverage quantitative data to make informed design decisions, providing a deep dive into methods like surveys and analytics. Whether you’re a novice or a seasoned professional, this course at Interaction Design Foundation offers valuable insights and practical knowledge, ensuring you acquire the skills necessary to excel in user experience research. Explore our diverse topics to elevate your understanding of quantitative research methods.
Earn a Gift, Answer a Short Quiz!
Question 1
Question 2
Question 3
Get Your Gift
Try Again! IxDF Cheers For You!
0 out of 3 questions answered correctly
Remember, the more you learn about design, the more you make yourself valuable.
It's Easy to Fast-Track Your Career with the World's Best Experts
Master complex skills effortlessly with proven best practices and toolkits directly from the world's top design experts. Meet your experts for this course:
Frank Spillers: Service Designer and Founder and CEO of Experience Dynamics.
Ann Blandford: Professor of Human-Computer Interaction at University College London.
Alan Dix: Author of the bestselling book “Human-Computer Interaction” and Director of the Computational Foundry at Swansea University.
The term card sorting applies to a wide variety of activities involving the grouping and/or naming of objects or concept
Book chapter
Open Access—Link to us!
We believe in Open Access and the democratization of knowledge. Unfortunately, world-class educational materials such as this page are normally hidden behind paywalls or in expensive textbooks.
 Author / Copyright holder: Teo Yu Siang and the