Looking forward to trying an Apple Watch? The expectations are high and the truth is that no one knows yet how far the Apple Watch will go. The product is in the market and many designers, developers, marketers and decision-makers are looking at its functionalities to decide what to do with this new device. Take Meetic.com, for example, who launched the first Apple Watch application to help you meet (and date) people.
![]()
Author/Copyright holder: Piwee. Copyright terms and licence: All rights reserved Img source
However, from looking at this ad, what really concerns us – as designers – are the icons that appear at the bottom left side. Meetic.com users connect to the website via their computer, their smartphone, their tablet and now alsovia their Apple Watch. That makes four different – but interrelated – devices and therefore contexts you should design for. How do we face such a challenging task?
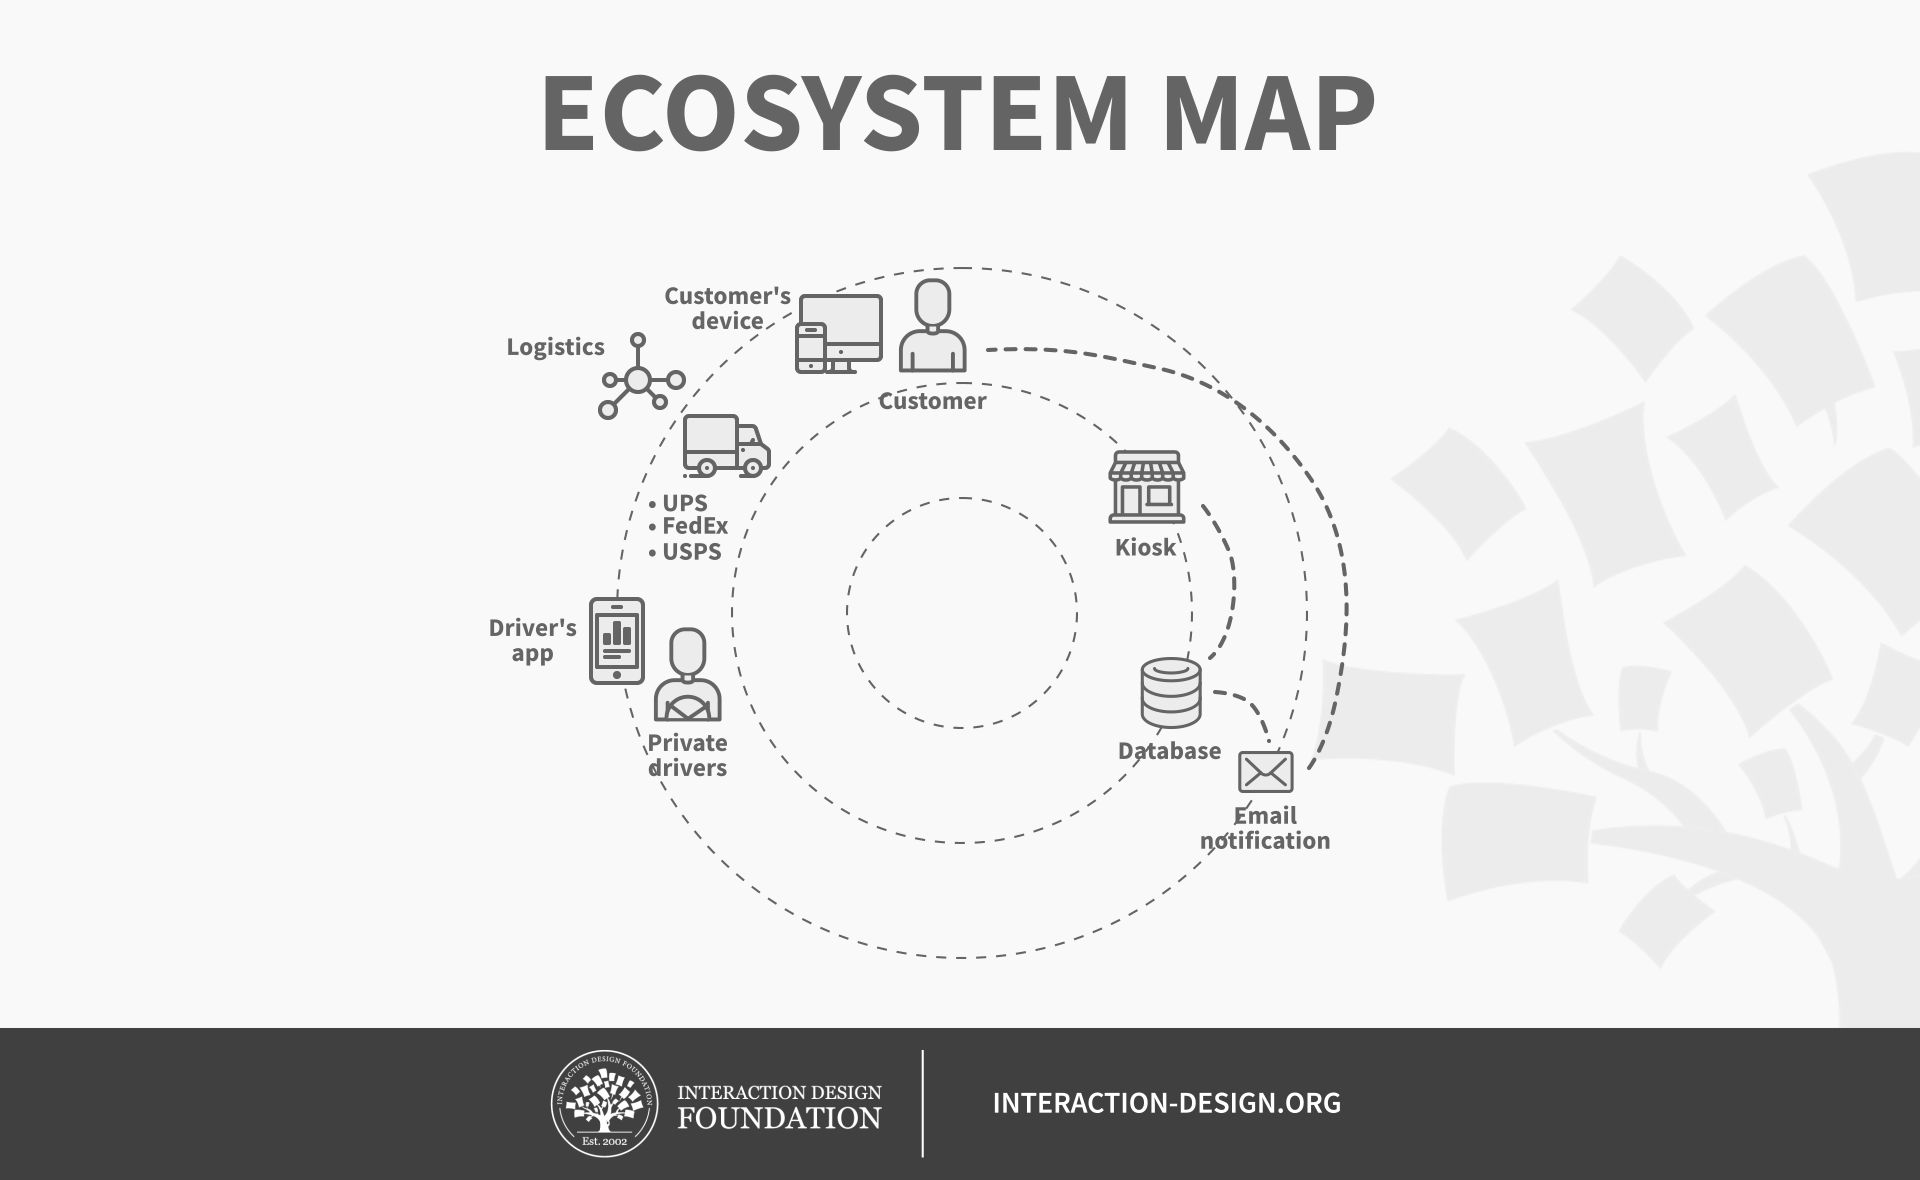
The answer lies in the concept of “User Experience Ecosystem”. The reason we call this phenomenon a “UX Ecosystem” as opposed to simply a “responsive design” in web design terminology is that a UX Ecosystem is very different from a mere responsive design across devices. A UX ecosystem encompasses a set of discrete but interdependent components, including, different domains (physical, digital, and hybrid), different types of entities (data, physical items, and people), and different media.
Like Dave Jones points out in his article, these components can be classified into:
- People who are managing information, sharing data with one another, and collaboratively building knowledge for themselves or an organization.
- The goals and practices of these people, both as individuals and as collaborators.
- The digital and analog technologies that they use to share information and interact with one another in meaningful ways.
- The information that these people share and value for their individual and collaborative purposes.
As a result, the individual’s goals and motivations, routines and processes, and the tools that he or she uses are always interconnected with other people, technologies, and practices.
The smartphone often seems to become the center of the UX ecosystem, but we constantly switch between devices and we expect all of them to synchronize; this is the genesis of the ecosystem.
How does this affect your work as a designer?
As a UX professional, you need to expand your skills and be able to focus on broader experiences than just individual users engaged with single applications.
Here are some initial takeaways. In a UX ecosystem:
- Users expect simple interfaces to facilitate switching between devices
- A consistent and – at the same time – device-specific interaction and graphic design
- Each device should be used for what it is best at, and – at the same time– we expect to have the same information available everywhere.
- The expectation of the experience is carried over the different devices and context. So far, Apple is the leading brand in creating these seamless experiences between the digital and physical world and between different software and hardware.
- There is a consistent brand experience across all touch-points.
- Interactions become non-linear due to the context and device switching.
- Cloud and wireless interactions are also part of the ecosystem and need to be designed.
![]()
Author/Copyright holder: Pablo Sanchez. Copyright terms and licence: All rights reserved. Img sourc
To sum up, your goal as a UX designer is to design a user-centered ecosystem of devices, objects and services across platforms in a simple, delightful and cohesive way which requires understanding people as social, cultural, and organizational components who are linked to other people, other technologies, and loads of information. Feeling stressed now? Don’t be! These new challenges will of course make your job much more demanding and difficult but that’s one of the reasons you became a designer, right? Because you love to solve complex design problems!