So you’ve got piles of data gathered from the inspiring empathy research activities you’ve undertaken, and you’re blankly staring at the data thinking, “Where to from here …?” and “What do I do with all this information?” It’s time to bring all the research you’ve collected together and make sense of it all within the context of the design challenge that you and your team face. There are a variety of effective – and interesting – methods to help you synthesise and make sense of all the data you’ve gathered during your research. In Design Thinking, the first phase is the Research or Empathise phase, then you move on to the Define phase, in which you utilise several available methods to help you crystallise, synthesise, and summarise your understanding of who you’re designing for and what your users really need.
For example, you can tell significant and surprising user stories. You will often want to bring all of your data out into the open and visualise it during mapping sessions with team members. You can, for example, develop empathy maps and personas based on your research about your users. It often makes sense to immerse your personas in stories and flesh out the scenarios they find themselves in. Once you understand the full scope of your users’ worlds, you can then form a problem statement which is also known as a Point Of View. You then proceed to crystallising your problem statement into inspirational How Might We questions. The How Might We questions will lead the way into the Ideation sessions, which follow in the next and third phase of Design Thinking process.
In the following section, we’ll provide an introduction to the best Define methods.
Share Inspiring User Stories
 Author/Copyright holder: Teo Yu Siang and Interaction Design Foundation. Copyright terms and licence: CC BY-NC-SA 3.0
One way of making sense of your data is to share with your team the most inspiring stories you’ve heard from the people you’re designing for. Think about user stories or experiences that have stuck with you: stories which surprised you, made you curious, or verified or falsified your assumptions. Please note, it’s also important to look for stories which falsify your previous assumptions as you don’t want to risk moving forward just confirming your own wishes without really paying attention to your users’ core stories and needs. Stories will most likely not provide you with the ultimate solutions to your design challenge, but chances are they’ll resonate with your team. At the international design company IDEO, team members share inspiring stories with each other so that user stories become part of their collective consciousness.
The goal is to build a repository of stories for your team to draw from, tell, and retell. Capturing those resonant ideas and feelings, and building them into the very narrative of your team’s work helps everyone down the line.
– IDEO.org
Best Practice: Construct Your User Story Madlib
Try to tell the most essential stories and consider them to be a series of steps within a broader system.
As a [who are they], he/she wants to [what do they want to do], so that [their end goal].
Example: As a freelance consultant, Peter wants to easily schedule meetings, so that he can ensure his schedule is always organised and effective.
Example: As a corporate web designer, Lisa wants to improve the company’s website, so that users can easily find and get access to what they need.
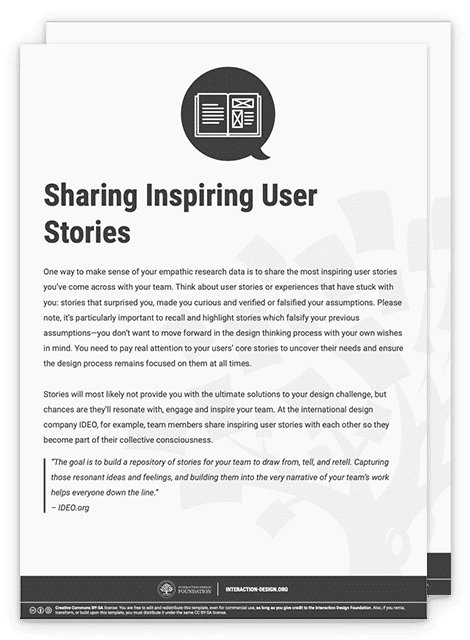
You can download and print the template for the method “Sharing Inspiring User Stories” which you and your team can use as a guide:

Make sense in your Research by Creating Maps
When you’ve developed a complex dataset during your initial research in the Design Thinking empathy mode, you will often have lots of interviews, actions, experiences and other information – constructing a map is generally a good method for making sense of the data. Mapping helps plot experiences, customer journeys, thought processes, a series of activities or actions and other related behaviour, as well as feelings, in one place. It would be useless having reams of data and not be able to understand the essence of it by extracting significant meaning from the data. This is a well-known issue in the business sector and synthesising methods can help you solve that problem.
Affinity Diagrams and Space Saturate and Group – Clustering and Bundling Ideas and Facts
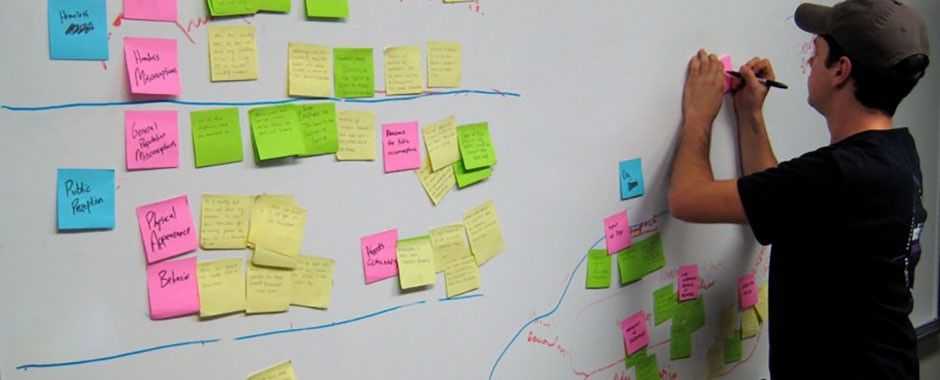
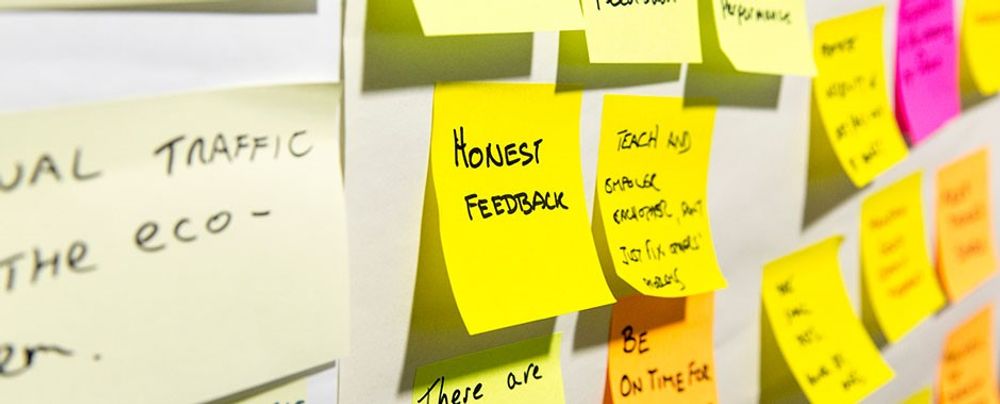
The “space saturate and group” method’s goal is to get all of your observations and findings into one place: Immerse yourself in the chaos of information you’ve gathered during your research Empathise phase. Get all of the information out into the open and get visual. Create a collage of all of your observations, data, experiences, interviews, thoughts, insights, and stories. Write on post-its, draw your insights, tell stories, and share artifacts.
Your team should write and draw all relevant information on post-it notes and group the items one-by-one. You should name the groups, rank the groups, and seek to understand their relationships in order to condense insights, user needs, pain points, or look for gaps you haven’t addressed yet.
The term “saturate” relates to the way everyone covers or saturates the “space” with their images and notes in order to create a wall of information to inform and start “grouping” the following problem-defining process. You then draw connections between these individual elements, or nodes, join the dots and develop new and deeper insights, which themselves help define the problem(s) and develop potential ideas for solutions. In other words, you go from analysis to synthesis. The method is also known as Affinity Diagram.

Get all of your information out into the open and visualise it during mapping sessions with your team members, then try to build themes and understand needs. Rank your findings and visualise connections to help you synthesise and make sense in your research results.
Empathy Map
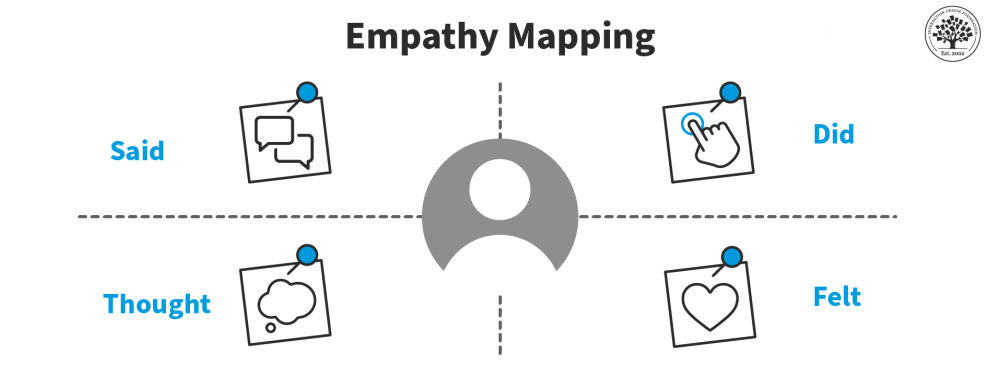
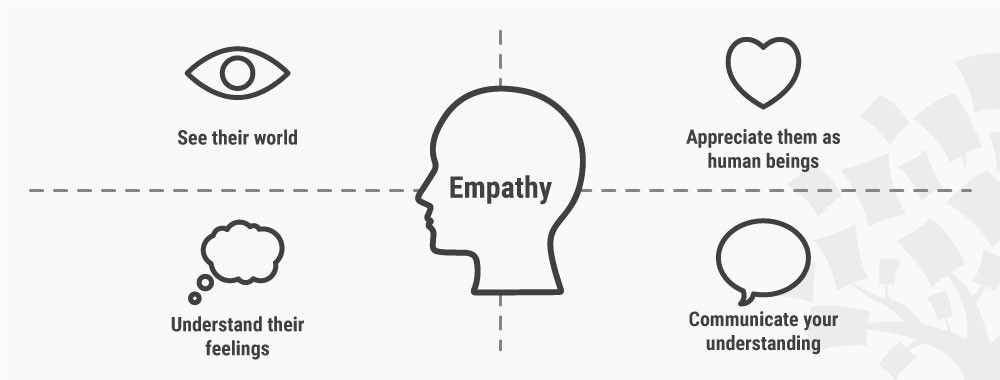
An Empathy map will help you understand your user’s needs whilst developing a deeper understanding of the person you are designing for. There are many techniques available for you to develop this type of empathy. An Empathy Map is one method that will help you define and synthesise your observations from your fieldwork and research phase, and draw out insights about your users’ needs. An empathy map consists of four quadrants, reflecting four key traits that the user possessed during the research stage. The four quadrants refer to what the user: Said, Did, Thought, and Felt.
 Author/Copyright holder: Teo Yu Siang and Interaction Design Foundation. Copyright terms and licence: CC BY-NC-SA 3.0
An empathy map consists of four quadrants which refer to what the users: Said, Did, Thought, and Felt.
Personas
 Author/Copyright holder: Teo Yu Siang and Interaction Design Foundation. Copyright terms and licence: CC BY-NC-SA 3.0
Personas are fictional characters, which, based on your research, you create to represent the different user types that might use your service, product, site, or brand in a similar way. When you create personas you will understand your users’ needs, behaviours, and goals – it will help you step out of yourself. It helps you recognise that different people have different needs and expectations, and it helps you to identify with the user you’re designing for. Personas make the design task at hand less complex, they guide your ideation processes, and they help you achieve the goal of creating a good user experience for your target user group.
Stories
 Author/Copyright holder: Teo Yu Siang and Interaction Design Foundation. Copyright terms and licence: CC BY-NC-SA 3.0
User stories are short stories that aim to insert the Persona into a situation in which he or she is using your product or aiming to fulfill the goal you seek to match. At this point, you should ignore minor details and get to the root of the who, what and why of the situation. Madlibs can be used to generate simple user stories which can serve as a guiding tool to ensure that the solution you seek to design meets the user’s needs and your insights about the user.
Scenarios
Scenarios expand on user stories and fill in many valuable human and environmental factors, which flesh out the story providing much more meaning for exploring various aspects of the solution. Scenarios provide us with the context within which our personas function, and how their experiences and needs play out. It helps us to visualise the Persona within a given context and how their various experiences play out. Scenarios relate to specific needs that the Persona is trying to fulfill with associated detail and this may prove helpful in understanding how to approach solutions.
Define Your Point Of View (POV)
 Author/Copyright holder: Teo Yu Siang and Interaction Design Foundation. Copyright terms and licence: CC BY-NC-SA 3.0
By the end of your Define mode, you should end up creating an actionable problem statement, also known as your Point of View (POV). You form your Point of View by extracting the most important insights about your users’ core human needs that you should fulfill within the problem area you’re investigating and designing for. The POV should not contain any specific solution, nor should it contain any indication as to how those needs should be fulfilled. Instead, it should provide a wide enough scope for imagining solutions, which go beyond status quo.
Frame Your POV with How Might We Questions
When you’ve defined your design challenge in a POV, you can start opening up for ideas to solve your design challenge by asking “How Might We”. You’re now moving on to the next phase of the Design Thinking process, the third phase: Ideation. You start by rephrasing and framing your POV as several questions by adding “How might we” at the beginning of the POV. How Might We questions are the best way to open up Brainstorm and other Ideation sessions. HMW opens up to Ideation sessions where you explore ideas that can help you solve your design challenge in an innovative way while making your users, their needs and your insights about them, your guide.
Why-How Laddering
"As a general rule, asking 'why’ yields more abstract statements and asking 'how’ yields specific statements. Often times abstract statements are more meaningful but not as directly actionable, and the opposite is true of more specific statements."
– d.school, Method Card, Why-How Laddering
For this reason, during the Define stage, designers seek to define the problem, and will generally ask why? Designers will use why to progress to the top of the so-called Why-How Ladder where the ultimate aim is to find out how you can solve one or more problems. Your How Might We questions will help you move from the Define stage and into the next stage in Design Thinking, the Ideation stage, where you start looking for specific innovative solutions. In other words, you could say that the Why-How Laddering starts with asking Why to work out How they can solve the specific problem or design challenge.
The Take Away
In the second phase of the Design Thinking process, there are a variety of methods you can use to help you and your team define, synthesise, organise, and theme your research from the Empathise mode, the first phase in the Design Thinking process. These Define methods will help you tell the right stories, map and understand user insights and needs, construct personas and immerse them into scenarios and stories. These Define methods will help you create a comprehensive view of your design challenge. Once you have an overview of the design challenge, you’re ready to construct your essential problem statement, also known as the Point Of View. In your Point Of View, you define your core design challenge, your user’s essential needs and your insights about them. Your Point of View allows you to open up for How Might We questions, which will guide your Ideation sessions during which you start to look for various design solutions to your design challenge.
References & Where to Learn More
Nielsen, Lene, Personas. In: Soegaard, Mads and Dam, Rikke Friis (eds.). The Encyclopedia of Human-Computer Interaction, 2nd Ed. Aarhus, Denmark: The Interaction Design Foundation, 2013.
Nikki Knox, Persona Empathy Mapping, UX Magazine, 2014.
Jason Travis, Persona Project.
Tuzzit, Empathy Map Template.
Tuzzit Tools, Collaborative Whiteboard for Visual Methodologies.
IDEO, HCD Connect, Extract Key Insights Method Guide.
The Innovation Catalyst Program, Affinity Clustering.
Chris Gielow, Affinity Mapping Time-lapse, 2010:
d.school, Bootcamp Bootleg, 2011.
Idea.org, Methods.
Hero Image: Author/Copyright holder: Jason de Runa. Copyright terms and licence: CC BY 2.0
